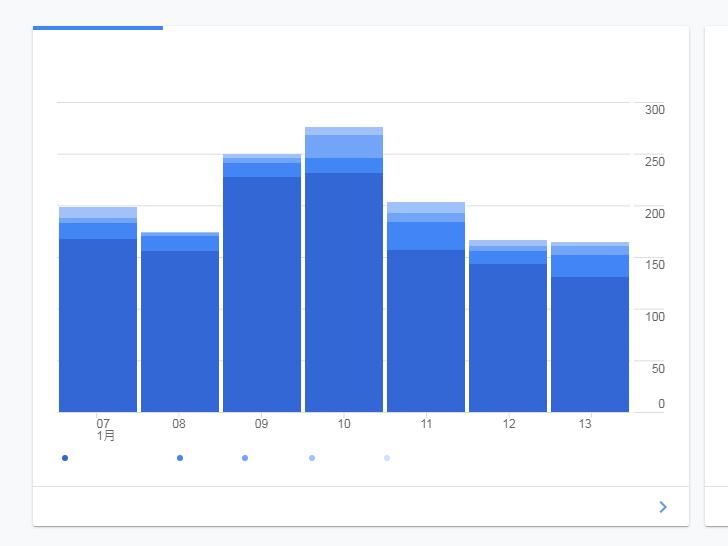
chart名詞
解釋及圖表的其它英文說法
plot
圖表英文例句
- The sales chart shows an increase in revenue over the past year.
銷售圖表顯示過去一年收入增加。 - We use a pie chart to represent the distribution of our budget.
我們使用餅圖表示我們預算的分配情況。 - The bar chart compares the sales figures for each quarter.
柱狀圖比較了每個季度的銷售數字。 - The organization chart outlines the company's hierarchical structure.
組織圖表列出了公司的層次結構。 - The line chart displays the trend of website traffic over the past month.
折線圖顯示了過去一個月網站流量的趨勢。 - Analysts use a scatter plot to identify any correlations between variables.
分析師使用散點圖來識別變數之間的相關性。 - The flow chart illustrates the steps in the production process.
流程圖說明了生產過程中的步驟。 - This radar chart shows the strengths and weaknesses of different products.
這張雷達圖顯示了不同產品的優勢和劣勢。 - The organization uses a Gantt chart to track project timelines.
這個組織使用甘特圖來追蹤專案的時間表。 - A histogram is used to represent the frequency distribution of data.
直方圖用來表示資料的頻率分佈。
圖表英文圖片

圖表英文相關文章
也許你有聽過一句英文諺語:A picture is worth a thousand words.直譯是「一張圖片等於一千個字」,意思就是 有時候一張圖片比再多的文字描述都還要有力量。在看這句諺語前,先來拆解幾個單字:
picture = 圖片、照片
wort ...
